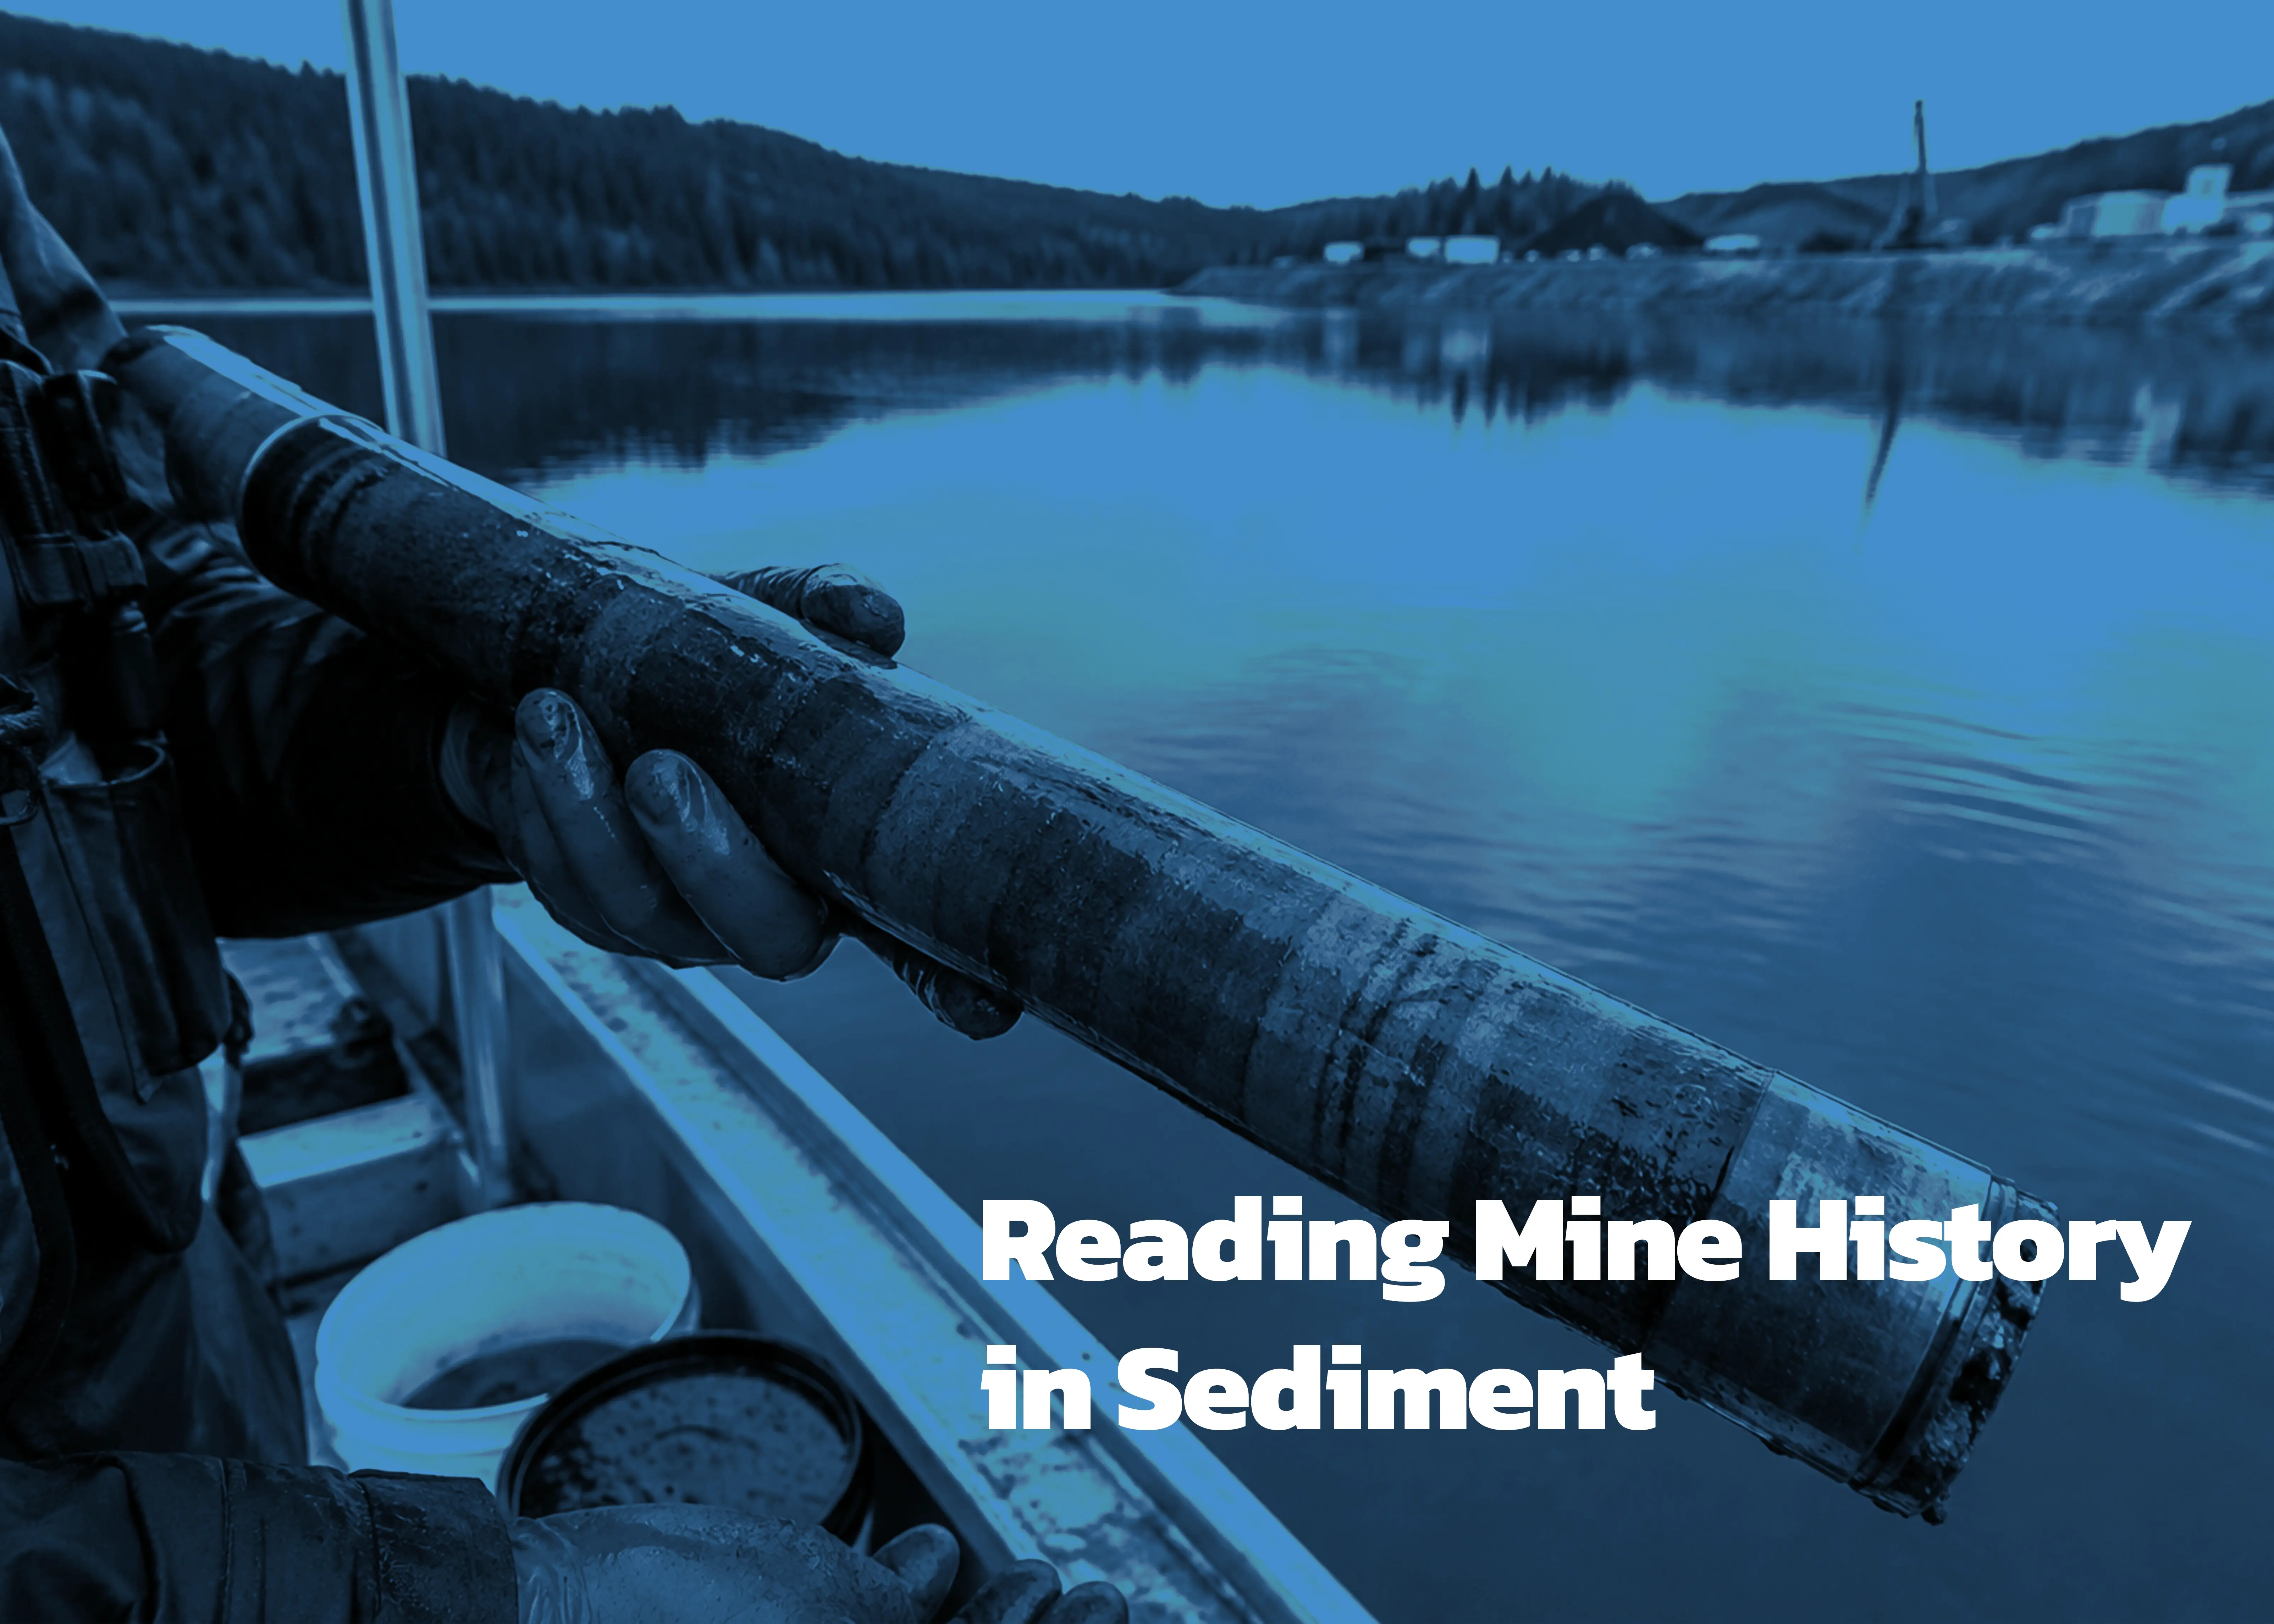
From the surface, a mine pond can appear almost featureless: a sheet of water offering few clues about what lies beneath. But on the pond floor, sediment has been accumulating through years of operation, treatment, shutdown, and environmental change.
Retrieve a vertical core from that sediment and the history becomes visible.
Recent material sits near the top. Deeper layers may correspond to active mining, changes in ore processing, treatment campaigns, floods, spills, or long periods of inactivity. Shifts in colour, texture, mineral composition, and metal concentration can reveal when contamination began, how it changed, and whether recovery is underway.
An Archive—But Not a Perfect Calendar
Sediment forms as mineral grains, organic matter, mine-derived solids, and metal-bearing precipitates settle from the water column. In calm depositional zones, new material accumulates over old, preserving a sequence that may span decades.
Some transitions are visible immediately. Rust-coloured bands may contain iron oxides precipitated from mine drainage. Dark sediment can indicate oxygen-poor conditions in which metal sulfides have formed. A coarse layer may record a flood, while an abrupt change in texture may correspond to a new process stream or treatment campaign.
Yet sediment does not keep perfect time. A thin layer may represent years of gradual accumulation or one intense storm. Currents, pumping, dredging, ice, and burrowing organisms can mix or relocate material. A core collected near an inflow may tell a very different story from one retrieved in a deep, undisturbed basin.
That is why bathymetry and sediment-floor mapping matter. They help identify accumulation zones, channels, deltas, and areas vulnerable to erosion. Multiple cores can then show whether a layer is widespread, localized, disturbed, or missing.
Reading the Chemistry
In the laboratory, a core is divided into depth intervals and analyzed for metals such as nickel, copper, cobalt, zinc, lead, arsenic, iron, and manganese. Grain size, mineralogy, organic carbon, pH, pore-water chemistry, and oxidation-reduction conditions help explain how those metals are stored.
This distinction is crucial. Total metal concentration is not the same as mobility or toxicity. A metal locked inside a resistant mineral grain may remain stable, while the same metal dissolved in pore water or attached to an iron oxide may be released if pH or oxygen conditions change.
The U.S. Environmental Protection Agency therefore cautions against evaluating sediment risk from bulk metal concentrations alone. Pore-water measurements, sediment toxicity, organic carbon, and metal-binding sulfides can provide a more complete picture.
Giving the Layers a Date
Depth establishes sequence, but not exact age. Scientists use independent markers to construct a timeline.
The U.S. Geological Survey uses radionuclides such as lead-210 and cesium-137 to date suitable lake and reservoir sediments. At mine sites, operating records, aerial imagery, documented floods, changes in ore type, and the boundary between native ground and deposited material can provide additional reference points.
When several lines of evidence agree, a metal profile can be aligned with site history. A rise in copper may match a period of active processing. Lower concentrations above it may show that treatment worked. A later increase can reveal renewed loading or erosion that surface-water monitoring failed to capture.
From History to Remediation
Cores can distinguish natural geochemical background from mine-related contamination, define the depth of affected material, and reveal whether cleaner sediment is burying older deposits.
Combined with bathymetry, multiple cores turn a vertical record into a three-dimensional plan. They help estimate the area, thickness, volume, and approximate mass of contaminated sediment while identifying priority zones for monitoring, capping, dredging, or excavation.
They also expose a common misconception: clean surface sediment does not necessarily mean the problem has disappeared. A thin, recent layer may conceal a substantial metal inventory below. Flooding, pumping, construction, or dredging can expose that material and alter its chemistry.
Risk, Recovery, or Both?
Metal-rich sediment may also contain recoverable value. But concentration alone does not establish feasibility. Recovery depends on mineralogy, chemical form, particle size, deposit volume, accessibility, and the consequences of disturbing the material.
Core analysis can identify intervals that deserve further testing and show whether buried metals are entering pore water or the overlying water column. For dissolved metals, PMAP’s selective-precipitation technology can concentrate targets such as nickel, copper, and cobalt as part of a broader treatment strategy.
PMAP combines unmanned core sampling, bathymetry, sediment mapping, and depth-specific water monitoring to investigate difficult or hazardous mine water bodies.
A surface sample provides a snapshot. A sediment core provides the story: how the site reached its present condition, what remains buried, and what could happen next.